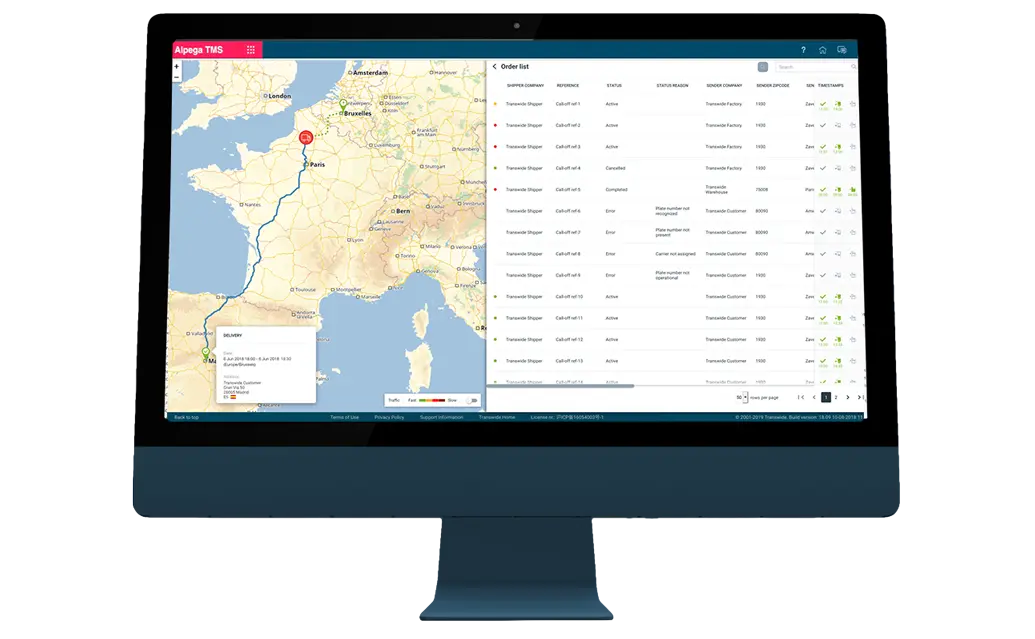

Alpega’s Analytics suite uses visual reports covering major transport metrics to deliver a detailed view of performance, freight costs and individual carrier score cards. Our performance reporting software puts actionable insights into your hands to make faster, smarter, data-driven business decisions.
You can analyze historical data to take corrective measures and improve customer service, but the real value comes from thinking holistically. Use Alpega’s Analytics suite to quickly evolve and gain strategic and operational control over your transportation performance.
Automated workflows collect data automatically and feed into more advanced processes for better execution and increased visibility. This data insight and deep integration leads to faster invoice processing, a reduction of buffer inventory, a centralized logistics function and increased performance visibility based on standardized, automated workflows.
Alpega Analytics will help you:









The most successful companies are able to adapt to rapidly changing market conditions. They seize opportunities when they present themselves and are always one step ahead of the competition. That’s because they’re data driven. By collecting, analyzing and acting on historical data, benchmarking market prices and digitalizing the RFQ process, businesses are able to drive real value and stop wasting time in Excel.
But data is only half the story: turning information into actionable intelligence demands insight if you are going to outperform the competition.
Operational excellence is characterized by metrics such as:
These metrics are reflected financially. This starts with recognizing the actual transport spend vs budget. However, financial analytics can be taken much deeper, looking at the annual spend per lane, the percentage of transport costs taken up by fuel surcharges or annual carrier accessorial fees.


The analytics suite included in Alpega TMS lets you monitor several important transport metrics, including the average fill rate of trucks, loading team efficiency, acceptance rates of loads and more. Data-driven insights mean cost reductions and efficiency gains for your business. Since every business’s metrics are unique, let’s discuss a transport analytics solution based on your needs – get in touch.
There are 9 core KPIs to keep in mind when running a transport analysis. Cost metrics include: freight cost for each unit shipped; outbound freight costs compared to total sales; inbound freight costs compared to purchases; claims versus freight costs; and accessorials compared to total freight costs. Additional relevant metrics are transportation time, freight billing accuracy, trucking capacity use and mode selection compared to optimal use. Find more transportation terms in our digital logistics and transportation management glossary.
Alpega’s analytics suite puts key transportation metrics at your fingertips, including historical data and visual reports to optimize your transport analysis. These capabilities fuel holistic analysis and easier identification of optimization areas. And since Alpega TMS collects real-time data, you’ll gain a speed advantage when reacting to unexpected events in your supply chain.
While many analyses focus on managing transportation costs, you can also identify problem areas with safety, compliance, and customer service. By fixing these issues, you can fully optimize your transportation performance to achieve operational excellence and business success.
